
CGE-SyDWEM Overview
Introduction
Future demand for water, energy, and food would continue to grow due to increasing population, economic development, and rising living standard, which poses significant challenges to natural resources sustainability and environmental protection. Security of water, energy, food, and environment is essential to sustainable development, as highlighted in 17 sustainable development goals (SDGs) adopted by the United Nations, e.g., ensuring water and sanitation for all (Goal 6), food security and improved nutrition (Goal 2), affordable and reliable energy (Goal 7), and combating climate change and its impacts (Goal 13). A key element in managing water, environment, energy, and food (WEEF) systems is that they are interconnected and thus form a nexus, i.e., the WEEF nexus, as sketched in Figure 1. The sustainability of WEEF security cannot be accomplished without appropriately considering this nexus.
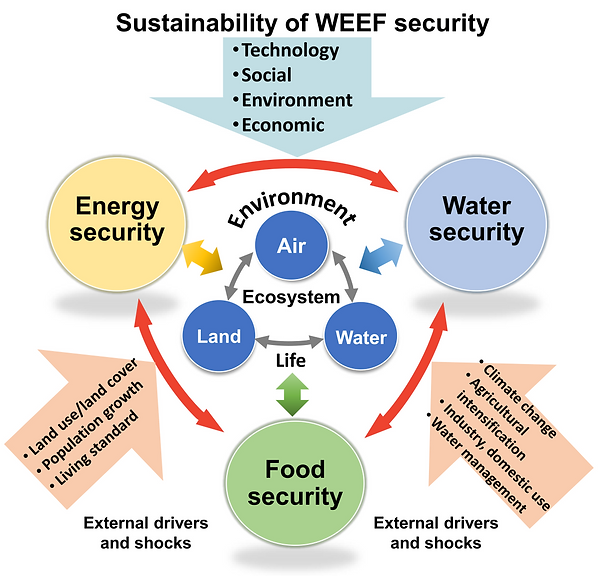
Figure 1. Schematic representation of the water-environment-energy-food nexus interactions among different components, the external drivers and shocks, and factors that affect the sustainability of WEEF security (Singh and Su, 2022)
CGE-SyDWEM Framework
Few tools exist to aid decision-making regarding the management of water, food, and energy resources at the watershed level. CGE-SyDWEM is developed to capture the cross-sector interactions and feedback among economic, energy, and water systems, which can help policymakers identify the possible co-benefits or trade-offs across different systems and design effective policies and measures.
Figure 2 illustrates the conceptual integration of the CGE and SyDWEM models. The IMED|CGE (Integrated Model of Energy, Environment and Economy for Sustainable Development | Computable General Equilibrium) model includes a production block; a market block with domestic, government, and household income and expenditure blocks; and international transactions. The CGE model can simulate GHG emissions from energy use, macroeconomic impacts (e.g., GDP, government expenditure, welfare, import, and export), detailed industrial outputs, and carbon intensity for each sector under carbon mitigation strategies.The System Dynamics and Water Environmental Model (SyDWEM) is used to simulate socio-economic subsystems, water infrastructures, and receiving water systems at the sub-watershed level. It includes five modules: (1) Population/GRP (Gross Regional Product, i.e., GDP for regional analysis) module; (2) Water demand/pollutant generation module; (3) Water supply module; (4) Sewer and WWTPs module; and (5) Receiving water module. More details of each module can be found in Su et al. (2018), Su et al. (2019) and Su et al. (2023).

Figure 2. Conceptual integration of the CGE and SyDWEM models (Su et al., 2023)
Related Papers
-
Su, Q.*, Dai, H., Xie, S., Yu, X., Lin, Y., Singh, V.P., and Karthikeyan, R., 2023. Water-energy-carbon nexus: greenhouse gas emissions from integrated urban drainage systems in China. Environmental Science & Technology. 57(5): 2093-2104.
-
Singh, V.P., and Su, Q., 2022. Water-Environment-Energy-Food Nexus: challenges and opportunities under climate change. Indian Journal of Soil Conservation. 50(3): 177-189.
-
Su, Q., Dai, H., Chen, H., Lin, Y., Xie, Y., and Karthikeyan, R., 2019. General equilibrium analysis of co-benefits and trade-offs of carbon mitigation on local industrial water use and pollutants discharge in China. Environmental Science & Technology. 53 (3): 1715–1724.
-
Su, Q., Dai, H., Lin, Y., Chen, H., and Karthikeyan, R., 2018. Modeling the carbon-energy-water nexus in a rapidly urbanizing catchment. Journal of Environmental Management. 225, 93-103. [cited by the IPCC AR6 report (Working Group III, 2022) to illustrate the cost and benefit of carbon mitigation]
-
Su, Q., Qin, H.P., and Fu, G.T., 2014. Environmental and ecological impacts of water supplement schemes in a heavily polluted estuary. Science of the Total Environment. 472C: 704-711.
-
Qin, H.P., Su, Q., and Khu, S.T., 2013. Assessment of environmental improvement measures using a novel integrated model. Journal of Environmental Management. 114: 486-495.
-
Qin, H.P., Su, Q., and Khu, S.T., 2011. An integrated model for water management in a rapidly urbanizing catchment. Environmental Modelling & Software. 26(12): 1502-1514.
-
Su, Q., Qin, H.P., and Zhao, Z.J., 2009. Modeling effects of regional industrial structure adjustment on water resource balance and water quality improvement. China Environmental Science. 29(7): 767-772. (in Chinese)
Irrigation Decision Support Tools and Dataset
Global scale monthly Priestley-Taylor (PT) coefficients for reference evapotranspiration (ETo) estimation
The Priestley-Taylor (PT) method is widely used in hydrologic and crop models to estimate reference evapotranspiration (ETo) or atmospheric demand for water. However, the default value of the PT coefficient (PTa=1.26) cannot assure reliability under different climatic regions. Here, we provide monthly PTa values at global scales with a spatial resolution of 0.25° using weather data from the daily Princeton Global Forcing dataset (0.25° × 0.25°, 1948-2016). The PTa values was calculated using an analytical expression for PT coefficient following the FAO-PM method. The data generated from this study can be directly incorporated into hydrologic and crop models using the PT method. Details can be found in our paper: Su, Q., and Singh, V.P. (2023). Calibration-free Priestley-Taylor Method for Reference Evapotranspiration Estimation, Water Resources Research, 59, e2022WR033198.
Cite this dataset: Su, Qiong (2023), “Global scale monthly Priestley-Taylor (PT) coefficients for reference evapotranspiration (ETo) estimation”, Mendeley Data, V1, doi: 10.17632/hnnddrbfbj.1 [download]